
The aim of this study is to understand how building height and street width impact street-level experience. Our research indicates that buildings (or the portion thereof) that reach up to 120ft. are what define the pedestrian's visual experience-- any area above that height has very little visual impact at the ground.
Analysis Methodology

Fig 1 - Typical Analysis
The street plane is divided into a regular grid and vectors are projected in all directions from each point. Next vectors are tested for intersection with the built context. Collectively, the intersection points visually recreate the image of the city as experienced from the ground level.

The points are colored based on their 'Height Value', depicted in the legend above, and the Y axis in the following graphs represents height. The X axis shows our set of points binned into representing segments of 20ft height intervals. To get a sense of where majority of the points lie, a color switch happens after encountering 80% of the points, and the color break height varies by study area.
New York City Study

Fig 2 - Lower Manhattan and Midtown, New York City
For the purpose of the study, 3 neighborhoods are selected in each of New York and London. The neighborhoods are carefully chosen to represent a variety of combinations of street widths and building heights:
- Park Avenue - High Rise, Wide Street
- Financial District - High Rise, Narrow Street
- Stuyvesant Town - Mid Rise, Wide Street
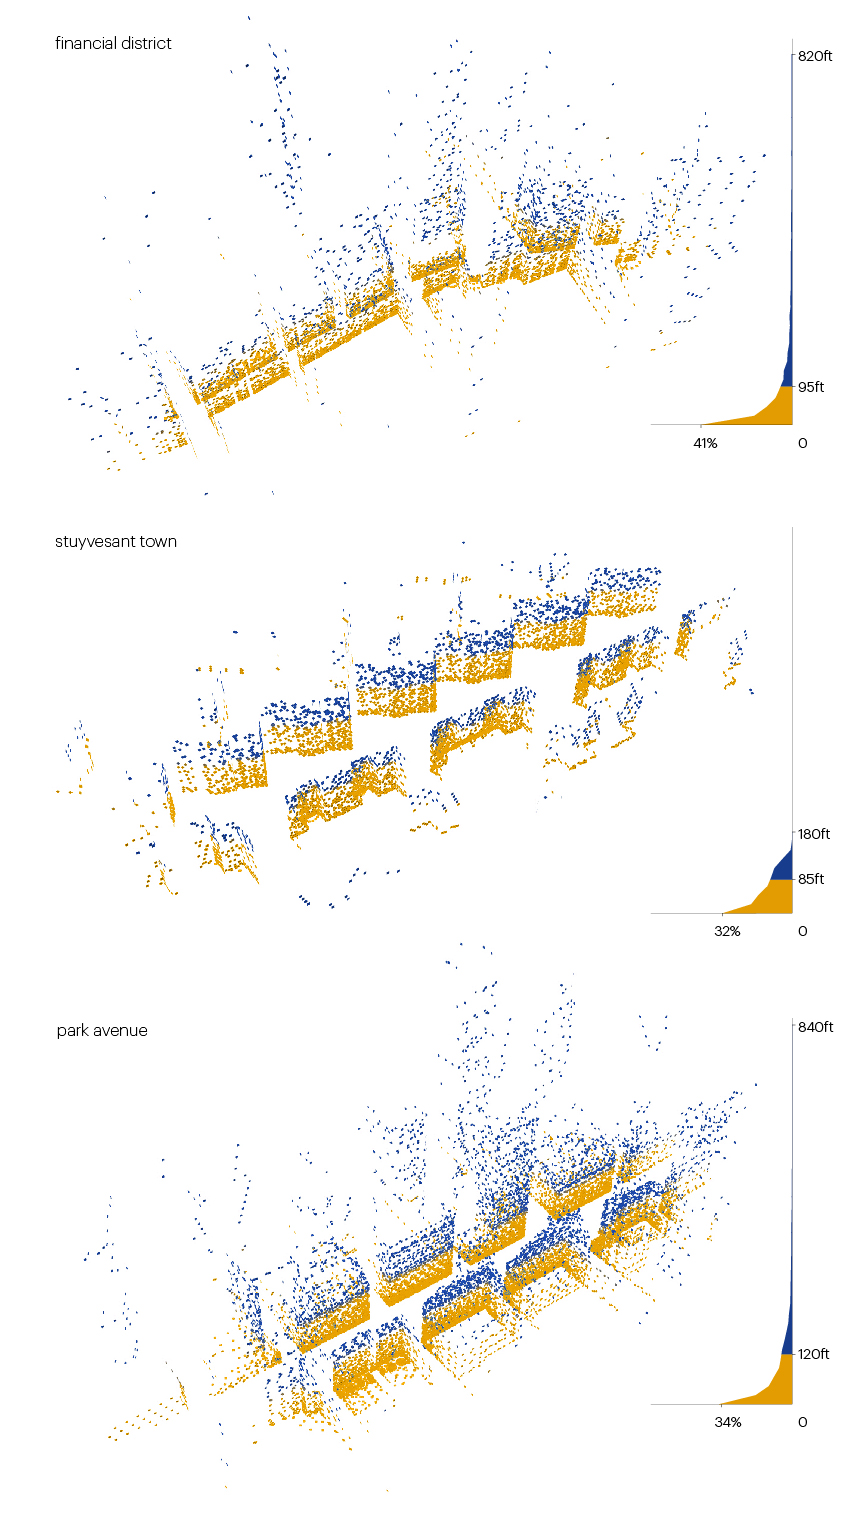
Fig 3 - New York City streets analysis
London City Study

Fig 4 - Locations in London City identified for analysis.
- Leadenhall Street - Mid Rise, Narrow Street
- Westminster - Low Rise, Wide Street
- Covent Garden - Low Rise, Narrow Street

Fig 5 - London streets analysis

Fig 6 - When applied to enough neighborhoods, the tool begins to create an experiential image of the city
Conclusions

Fig 7 - Analysis Graphs
In overlapping our six neighborhood graphs, a pattern begins to emerge: in high rise neighborhoods, 80% of the street experience is defined within 10-15% of the maximum height from the ground. On Narrow or Wide streets, Short or Tall towers, structures above 120ft have a minimal effect on the street experience, as they generally aren’t visible to passersby.

Fig 8 - Road Width Correlation
A close read of the graphs reveals that:
- for narrow streets - buildings closest to the ground have the maximum visual impact and that impact drops sharply with height;
- for wider streets - the lowest buildings contribute relatively less to the experience;
- for wider streets - higher buildings contribute relatively more to the experience.
This analysis suggests that street width has a direct correlation with the experience of surrounding building heights. Visibility on narrower streets is limited to buildings close to the ground. As the road width increases, more street experience is governed by taller towers. One possible takeaway is that perhaps signature elements of the building design should be concentrated at ground level, or whether design features should aim to draw the eye upward.