Announcing Summer 2024 Internships

We Are

KPF is a leading architecture and master planning firm that designs projects of various scales around the world. You will be working with the KPF Urban Interface (KPFui) team, which is a team focused on computational design, data analytics and technology development. KPFui uses data analytics for informed decision making in the design of buildings and cities for people.

We believe that smart cities & buildings are not about drones, sensors or autonomous vehicles. A truly smart city should leverage data to design better neighborhoods and utilize technology to make that data transparent and publicly accessible. We think people should be in control of technology and not the other way around.

NOTE: 2023 internship descriptions are the same for 2024, however, follow the instructions for applying at the end of this posting.

Role Description

We are looking for a candidate that can work across the world of architectural design, urban planning, and technology and primarily within one of four technical areas:

  1. C# / Rhino Common / dotNET software development
  2. Front end web development
  3. Computational Urban Design in Rhino + Grasshopper
  4. Smart urbanism research

We've created individual postings for each of the technical areas, but candidates don't need to be limited to one category.

Application

Please apply by submitting a CV, portfolio or website, and an additional relevant material, such as GitHub or writing sample, to lwilson@kpf.com, jszychowska@kpf.com, and ysun@kpf.com with the subject line “Summer Internship 2024 Application.” Please indicate which area(s) you are applying to work on. The deadline to apply is April 5th.

Logistics

Pay: $25 an hour and $37.5 an hour for overtime.

Time range: 10 - 12 weeks. Start date and end date are flexible.

Location: The internship will be in New York City.

Internship Summer 2023: C# / Rhino Development

March 27th. No Longer accepting applications. (If you have already applied, don’t worry we got your application.)

We Are

KPF is a leading architecture and master planning firm that designs projects of various scales around the world. You will be working with the KPF Urban Interface (KPFui) team, which is a team focused on computational design, data analytics and technology development. KPFui uses data analytics for informed decision making in the design of buildings and cities for people.

We believe that smart cities & buildings are not about drones, sensors or autonomous vehicles. A truly smart city should leverage data to design better neighborhoods and utilize technology to make that data transparent and publicly accessible. We think people should be in control of technology and not the other way around.

Role Description

We are looking for a candidate that can work across the world of architectural design, urban planning, and technology and within one of five technical areas:

  1. C# / Rhino Common / dotNET software development
  2. Front end web development
  3. Machine Learning / AI
  4. Computational Urban Design in Rhino + Grasshopper
  5. Smart urbanism research

We've created individual postings for each of the technical areas, but candidates don't need to be limited to one category. For example, someone interested in Machine Learning may also want to build a front-end framework to test their models, or someone researching Smart Urbanism could use their findings to develop computational design tools. To learn more, click the links above.

By joining us, you’ll have the opportunity to collaborate and learn from others working in all five internship areas.

C# / Rhino Common / dotNET Software Development

Overview

This role centers around how to scale the tools, workflows, and innovations from KPFui to the entire office through the development of Rhino + Grasshopper Plugins and Rhino.Compute. In addition to scaling tools developed as part of KPFui, you will collaborate with and across teams at KPF, such as the Environmental Performance and Data Science teams, to look for opportunities to deploy new tools, leverage automation, and apply machine learning models within design practice.

Skills Required

  • Familiarity with Rhino Common
  • Experience developing applications in C#, preferable plug-ins for Rhino or Grasshopper

Learning Opportunities

  • Development principles and design patterns for C# applications
  • C# Programming principles and design patterns
  • UI development with WPF (Windows Presentation Foundations)
  • Learning version control and collaboration through GitHub
  • Front end web development with Vue.js
  • Rhino.compute

Application

Please apply by submitting a CV, portfolio or website, and an additional relevant material, such as GitHub or writing sample, to lwilson@kpf.com and epietraszkiewic@kpf.com with the subject line “Summer Internship 2023 Application.” Please indicate which area(s) you are applying to work on. The deadline to apply is March 30th.

Logistics

Pay: $25 an hour and $37.5 an hour for overtime.

Time range: 10 - 12 weeks. Start date and end date are flexible.

Location: The internship will be in New York City.

Internship Summer 2023: Machine Learning

March 27th. No Longer accepting applications. (If you have already applied, don’t worry we got your application.)

We Are

KPF is a leading architecture and master planning firm that designs projects of various scales around the world. You will be working with the KPF Urban Interface (KPFui) team, which is a team focused on computational design, data analytics and technology development. KPFui uses data analytics for informed decision making in the design of buildings and cities for people.

We believe that smart cities & buildings are not about drones, sensors or autonomous vehicles. A truly smart city should leverage data to design better neighborhoods and utilize technology to make that data transparent and publicly accessible. We think people should be in control of technology and not the other way around.

Role Description

We are looking for a candidate that can work across the world of architectural design, urban planning, and technology and within one of five technical areas:

  1. C# / Rhino Common / dotNET software development
  2. Front end web development
  3. Machine Learning / AI
  4. Computational Urban Design in Rhino + Grasshopper
  5. Smart urbanism research

We've created individual postings for each of the technical areas, but candidates don't need to be limited to one category. For example, someone interested in Machine Learning may also want to build a front-end framework to test their models, or someone researching Smart Urbanism could use their findings to develop computational design tools. To learn more, click the links above.

By joining us, you’ll have the opportunity to collaborate and learn from others working in all five internship areas.

Machine Learning

Overview

This role focuses on collaborating with KPF's data scientists to identify opportunities to develop and apply machine learning models across the KPF practice. This includes exploring spatial and design questions, such as: what can be learned from the spatial datasets created across thousands of global design projects? Can a model be trained to describe the unique "vibe" of great urban places? In addition to exploring datasets and training ML models, you will have the chance to implement the models in tools for office-wide use. A background in design or urbanism is not required, but you should have a strong interest in the intersection of technology and the built environment.

Skills Required

  • Python and data science libraries such as SciKit Learn and Pandas as a base
  • Deep learning experience, ideally with PyTorch
  • Bonus points for AWS experience and knowledge of Flask or FastAPI to build APIs

Learning Opportunities

  • JavaScript / Vue.js
  • Three.js / WebGL
  • Design and Urbanism
  • Creating and implementing RESTful APIs
  • UI/UX Design
  • Learning version control and collaboration through GitHub

Application

Please apply by submitting a CV, portfolio or website, and an additional relevant material, such as GitHub or writing sample, to lwilson@kpf.com and epietraszkiewic@kpf.com with the subject line “Summer Internship 2023 Application.” Please indicate which area(s) you are applying to work on. The deadline to apply is March 30th.

Logistics

Pay: $25 an hour and $37.5 an hour for overtime.

Time range: 10 - 12 weeks. Start date and end date are flexible.

Location: The internship will be in New York City.

Internship Summer 2023: Computational Urban Design

March 27th. No Longer accepting applications. (If you have already applied, don’t worry we got your application.)

We Are

KPF is a leading architecture and master planning firm that designs projects of various scales around the world. You will be working with the KPF Urban Interface (KPFui) team, which is a team focused on computational design, data analytics and technology development. KPFui uses data analytics for informed decision making in the design of buildings and cities for people.

We believe that smart cities & buildings are not about drones, sensors or autonomous vehicles. A truly smart city should leverage data to design better neighborhoods and utilize technology to make that data transparent and publicly accessible. We think people should be in control of technology and not the other way around.

Role Description

We are looking for a candidate that can work across the world of architectural design, urban planning, and technology and within one of five technical areas:

  1. C# / Rhino Common / dotNET software development
  2. Front end web development
  3. Machine Learning / AI
  4. Computational Urban Design in Rhino + Grasshopper
  5. Smart urbanism research

We've created individual postings for each of the technical areas, but candidates don't need to be limited to one category. For example, someone interested in Machine Learning may also want to build a front-end framework to test their models, or someone researching Smart Urbanism could use their findings to develop computational design tools. To learn more, click the links above.

By joining us, you’ll have the opportunity to collaborate and learn from others working in all five internship areas.

Computational Urban Design

Overview

In this role, you will use, modify, and develop computational design tools in Grasshopper for application on urban design projects at KPF. You will collaborate with project teams to analyze the performance of their designs and provide design recommendations to facilitate performance-driven decision making. The analysis will cover topics such as views and daylighting for buildings, origin/destination routing for mobility, outdoor thermal comfort for open space, and research and development of new tools. You will also look for opportunities to automate workflows and embed expert knowledge in design tools, in collaboration with project teams and others on the UI team.

Skills Required

  • Expertise with Rhino and Grasshopper
  • Familiarity with simulation and analysis tools in grasshopper
  • Excellent graphic design and visual representation skills
  • Experience with Adobe InDesign

Learning Opportunities

  • Learn a programming language, either C# or Vue.js
  • How to develop computational urban design models and analyze design spaces
  • Communicating complex data and analysis in a clear and actionable manner

Application

Please apply by submitting a CV, portfolio or website, and an additional relevant material, such as GitHub or writing sample, to lwilson@kpf.com and epietraszkiewic@kpf.com with the subject line “Summer Internship 2023 Application.” Please indicate which area(s) you are applying to work on. The deadline to apply is March 30th.

Logistics

Pay: $25 an hour and $37.5 an hour for overtime.

Time range: 10 - 12 weeks. Start date and end date are flexible

Location: The internship will be in New York City.

Internship Summer 2023: Smart Urbanism Research

March 27th. No Longer accepting applications. (If you have already applied, don’t worry we got your application.)

We Are

KPF is a leading architecture and master planning firm that designs projects of various scales around the world. You will be working with the KPF Urban Interface (KPFui) team, which is a team focused on computational design, data analytics and technology development. KPFui uses data analytics for informed decision making in the design of buildings and cities for people.

We believe that smart cities & buildings are not about drones, sensors or autonomous vehicles. A truly smart city should leverage data to design better neighborhoods and utilize technology to make that data transparent and publicly accessible. We think people should be in control of technology and not the other way around.

Role Description

We are looking for a candidate that can work across the world of architectural design, urban planning, and technology and within one of five technical areas:

  1. C# / Rhino Common / dotNET software development
  2. Front end web development
  3. Machine Learning / AI
  4. Computational Urban Design in Rhino + Grasshopper
  5. Smart urbanism research

We've created individual postings for each of the technical areas, but candidates don't need to be limited to one category. For example, someone interested in Machine Learning may also want to build a front-end framework to test their models, or someone researching Smart Urbanism could use their findings to develop computational design tools. To learn more, click the links above.

By joining us, you’ll have the opportunity to collaborate and learn from others working in all five internship areas.

Smart Urbanism Research

Overview

This position is a combination of urban and architectural research and production. You'll conduct research on smart urbanism trends and transform them into design guidelines, toolkits, datasets, and documents. The goal is to translate your research on topics such as AVs, drones, the future of retail, micro-mobility, and data-driven place making into actionable design intent. You'll work with project teams to implement your research-driven design guidelines into real projects. Candidates should have a strong interest in the intersection of technology and the built environment.

Skills Required

  • Experience doing research
  • Background in urbanism and design
  • Knowledge in Rhino and the Creative Suite is required and fluency in Grasshopper is strongly preferred.
  • Excellent in graphic design and writing

Learning Opportunities

  • Learn a programming language, either C# or Vue.js
  • Learn QGIS
  • Learn grasshopper and translate research into computational design tools
  • Develop an expertise in in smart urbanism topics

Application

Please apply by submitting a CV, portfolio or website, and an additional relevant material, such as GitHub or writing sample, to lwilson@kpf.com and epietraszkiewic@kpf.com with the subject line “Summer Internship 2023 Application.” Please indicate which area(s) you are applying to work on. The deadline to apply is March 30th.

Logistics

Pay: $25 an hour and $37.5 an hour for overtime.

Time range: 10 - 12 weeks. Start date and end date are flexible.

Location: The internship will be in New York City.

Internship Summer 2023: Front End Web Development

March 27th. No Longer accepting applications. (If you have already applied, don’t worry we got your application.)

We Are

KPF is a leading architecture and master planning firm that designs projects of various scales around the world. You will be working with the KPF Urban Interface (KPFui) team, which is a team focused on computational design, data analytics and technology development. KPFui uses data analytics for informed decision making in the design of buildings and cities for people.

We believe that smart cities & buildings are not about drones, sensors or autonomous vehicles. A truly smart city should leverage data to design better neighborhoods and utilize technology to make that data transparent and publicly accessible. We think people should be in control of technology and not the other way around.

Role Description

We are looking for a candidate that can work across the world of architectural design, urban planning, and technology and within one of five technical areas:

  1. C# / Rhino Common / dotNET software development
  2. Front end web development
  3. Machine Learning / AI
  4. Computational Urban Design in Rhino + Grasshopper
  5. Smart urbanism research

We've created individual postings for each of the technical areas, but candidates don't need to be limited to one category. For example, someone interested in Machine Learning may also want to build a front-end framework to test their models, or someone researching Smart Urbanism could use their findings to develop computational design tools. To learn more, click the links above.

By joining us, you’ll have the opportunity to collaborate and learn from others working in all five internship areas.

Front End Web Development

Overview

This role centers around how to scale the tools, workflows, and innovations from KPFui to the entire office through the development of web tools and web maps, which will impact real architectural and urban design projects. The ideal candidate for this position will leverage their software development background and interest in architecture and urban design to improve, add-to, and maintain internal products through the development of cloud-based simulation, new interfaces, such as Scout, and an interactive web map for understanding sidewalk crowding for re-opening business during the pandemic. In addition to scaling tools developed as part of KPFui, you will collaborate with and across teams at KPF, such as the Environmental Performance and Data Science teams, to look for opportunities to deploy new tools, leverage automation, and apply machine learning models within design practice.

Skills Required

  • Experience doing web development in JavaScript
  • Have experience with a modern front end framework

Learning Opportunities

  • Vue.js
  • Three.js / WebGL
  • Creating and implementing RESTful APIs
  • Creating web maps
  • UI/UX Design
  • Learning version control and collaboration through GitHub

Application

Please apply by submitting a CV, portfolio or website, and an additional relevant material, such as GitHub or writing sample, to lwilson@kpf.com and epietraszkiewic@kpf.com with the subject line “Summer Internship 2023 Application.” Please indicate which area(s) you are applying to work on. The deadline to apply is March 30th.

Logistics

Pay: $25 an hour and $37.5 an hour for overtime.

Time range: 10 - 12 weeks. Start date and end date are flexible.

Location: The internship will be in New York City.

Job Posting: Web Developer

Position Filled October 2022

We Are 

KPF is a leading architecture and master planning firm that designs projects of various scales around the world. You will be working on the KPF Urban Interface (KPFui) team, which is a team focused on computational design, data analytics and technology development. KPFui uses technology and data analytics for informed decision making in the design of buildings and cities for people. 

Role Description 

KPFui has successfully deployed a suite of tools as internal products to help shape the design, approval, and public engagement processes of KPF’s global projects. The ideal candidate for this position will leverage their software development background and interest in architecture and urban design to improve, add-to, and maintain internal products through the development of cloud-based simulation, new interfaces, such as Scout, and an interactive web map for understanding sidewalk crowding for re-opening business during the pandemic. 

In short, this role centers around how to scale the tools, workflows, and innovations from KPFui to the entire office through Software Development, Training, and Deployment -- all of which will impact the hundreds of buildings and urban design projects that KPF does a year.  

In addition to scaling tools developed with KPFui, you as part of the development team will collaborate with and across specialty teams at KPF, such as the Environmental Performance and Data Science teams, to look for opportunities to deploy new tools, leverage automation, and apply machine learning models within design practice.  

You will work as part of a growing development team with the support from consultants with deep experience in various programming environments to assist in both growth and learning. KPFui supports training and continuous education - we want you to have the support to develop and advance your skills and interests. 

Experience and Skills 

Minimum of 2 years’ experience in web development 

Need to have coming in: 

  • Designing and building production-level web applications.  

  • Building responsive & intuitive front-end web applications 

  • Vue.js (3.x+) JavaScript Framework 

  • CSS Framework (I.e., Bootstrap, Tailwind, or Vuetify) 

  • Develop technical interfaces, specifications, and system architecture of products. 

  • Ability to use Git for version control. 

  • Write clean, modular, documented, and scalable code. 

  • Develop and manage RESTful APIs. 

Optional, but will need to develop as part of your role: 

  • AWS (Amazon Web Services) Cloud Microservices 

  • Hands-on experience with Three.js 

  • Developing interactive web visualizations 

  • Experience working with other software developers. 

Not needed for the core part of your role but great if you have experience with or are interested in: 

  • Urban data analytics 

  • Machine learning 

  • GIS experience 

  • TypeScript 

  • Python 

Application 

Please apply by submitting a CV, portfolio, and links to any relevant development projects to lwilson@kpf.com with the subject line “Web Developer Application.” 

Job Posting: Product Developer + Computational Designer

POSITION FILLED 6/9/21

Contact: Brandon Pachuca bpachuca@kpf.com

We Are

KPF is a leading architecture and master planning firm that designs projects of various scales around the world. You will be working with the KPF Urban Interface (KPFui) team, which is a team focused on computational design, data analytics and technology development. KPFui uses data analytics for informed decision making in the design of buildings and cities for people.

Role Description

KPFui has successfully deployed a suite of tools as internal products to help shape the design, approval, and public engagement processes of KPF’s global projects. The ideal candidate for this position will leverage their design and software development background to improve, add-to, and maintain internal products through the development of cloud-based simulation and new interfaces, such as Scout.  

In short, this role centers around how to scale the tools, workflows, and innovations from KPFui to the entire office through Computational Design, Internal Product Development, and Training & Deployment -- all of which will impact the hundreds of projects that KPF designs and plans. 

In addition to scaling tools developed as part of KPFui, you will collaborate with and across teams at KPF, such as the Environmental Performance and Data Science teams, to look for opportunities to deploy new tools, leverage automation, and apply machine learning models within design practice. 

You will work as part of a growing development team with the support from consultants with deep experience in the various environments you will be developing within. The requirements outline below are quite extensive. If you have most but not all -- and think you are a good fit for the role and the team -- still apply for the position. KPFui supports training and education. We want you to have the support to develop and advance your skills and interests. 

Role Breakdown

The specific percent distribution of tasks and applications of those tasks can and will change to suit your skills and interests.  

60% Internal Product Development:  

Create internal products that take advantage of emerging technologies in computer science like Cloud Computing, AI, ML, Web Services, etc. to improve KPFui’s ability to effectively work with design teams.  

Work closely with other developers and computational designers on the team to create workflows that string together various web services and local libraries as well as existing grasshopper files and rhino geometries.  

Engage with the studio to translate the ever-changing needs of designers into distinct features for the evolution of our toolset, thus allowing it to be seamlessly integrated into design workflows.  

Develop useable and friendly interface for tools that clearly communicates complex data and analyses in a succinct manner to ensure frictionless adoption by project teams. The success of this role is crucial to the wide adoption of existing and new tools that facilitate and inform the work of the rest of the firm.  

20% Computational Design:  

Work with project teams to apply performance analyses and give design recommendations to guide performance-driven decision making from setting up analysis tools as grasshopper scripts to building new workflows, scripts, or plug-ins.   

This work will be focused on understanding the workflows, tasks and bottlenecks of the design teams in order to better inform product development.  

20% Education, Training and Deployment:  

Work to facilitate firmwide adoption of our internally developed tools. This will include running workshops and supporting teams in deploying and creating educational materials.  

Write clear tutorial and documentation on tools and workflows created that include instructions for set-up, step-by-step guide to use, and troubleshooting tips.

Experiences and Skills 

As Developer 

Need to have coming in: 

  • Familiar with the Rhino Common Library. 

  • Experience developing applications in C#, preferably plug-ins for Rhino or Grasshopper. 

  • Ability to use Git for version control.  

  • Develop technical interfaces, specifications, and architecture of products. 

  • Write clean, modular, documented, and scalable code. 

Optional, but will need to develop as part of your role: 

  • Develop intuitive user interfaces for windows, such as with ETO forms / WPF. 

  • Creating and implementing high-performance RESTful APIs. 

  • Experience working with other software developers. 

As Computational Designer 

Need to have coming in: 

  • Familiar with Rhino and Grasshopper.  

  • Ability to communicate and execute design intents specified by project teams. 

Optional, but will need to develop as part of your role: 

  • Experience creating generative or computational models in Grasshopper (we can teach this if you have not done this before.) 

  • Familiar with common simulation tools and Grasshopper plug-ins such as DIVA, Ladybug, DeCoding Spaces. (You’ll get exposure to simulation tools and plugins as part of the role if you are not already familiar with them.) 

As Outreach Educator 

Need to have coming in: 

  • Ability to communicate technical details of tools and the theory behind analysis with a variety of stakeholder such as, designers, architects, clients, and other developers. 

Optional, but will need to develop as part of your role: 

  • Create concise diagrams, documentation, and tutorials.  


Not required, but fantastic if you have some experience with: 

  • Three.js / WebGL / Vue 

  • Urban spatial analytics  

  • Autodesk Revit Software 

  • Python 

  • Rhino.Compute 

Application 

Please apply by submitting a CV, portfolio, and links to any relevant development projects to bpachuca@kpf.com with the subject line “Product Developer + Computation Designer Application.”  

Rhino Plug-in Development Consultant

Contact: Demi Chang| Dchang@kpf.com

KPF is a leading architecture and master planning firm that designs projects of various scales around the world. You will be working with the KPF Urban Interface (KPFui) team, which is a research and computation focused team within the firm. KPFui uses urban data analytics for informed decision making in the design of buildings and cities for people.

We’re looking for a Rhino developer to consult on the development of our Rhino.Compute platform, which allows designers in our office to run complex simulations and export design options to our 3D web viewer, Scout, all from Rhino desktop. You will attend weekly code reviews and help guide refactoring efforts by our Rhino developers, front-end developers, and system architects to create clean, modular, and scalable code using the Rhino.Common API. To start you will play an essential role in shaping the technical direction of our cloud computing and web visualization workflows by helping us review and execute better UI interfaces, data structures, and program architecture. In the future, there are opportunities beyond that to contribute to our suite of rapidly growing products developed by KPFui to support architectural designers making data informed decisions.

What you’ll do:

  • Weekly code reviews
  • Help guide code refactoring
  • Suggest Data structure improvement (C#, JSON)
  • Suggest UI interface improvement (ETO Panels, Front-end Web interfaces)

We'll expect you to have experience:

  • Experience with handling Rhino Common Geometries.
  • 3+ years' experience developing applications in C#.
  • Creating and implementing high-performance RESTful APIs.
  • Developing intuitive user interfaces for windows using ETO forms.
  • Developing technical interfaces, specifications and architecture of products.

If you've got some of these skills, even better:

  • Three.js/WebGL
  • Rhino 3D modelling software/Grasshopper
  • Urban spatial analytics experience
  • Autodesk Revit Software
  • Time Commitment and Fee:
  • Minimum 4 hours / up to 15 hours a month
  • Per hour rate consistent with experience level

Summer Smart Urbanism Research Internship

Who We Are

KPF is a leading architecture and master planning firm that designs projects of various scales around the world. You will be working on the KPF Urban Interface team, which is a research and computation focused team within the firm.

Role description

We are looking for a candidate that can work across the worlds of design, urban planning, and technology. This position is a combination of urban and architectural research and production. You will be conducting research in smart urbanism trends and turning them into design guidelines, toolkits, and documents. Along the way, you will assist in developing a sequence of exhibitions and experiments to test out the ideas crystallized in the research. Candidate should have a keen interest in the intersection of technology and the built environment.

Skills Required

A successful candidate is strong in graphics, reading, and writing. Knowledge in Rhino and Adobe Creative Suite is required and fluency in Grasshopper and GIS is strongly preferred. Experience in video production, experimental fabrication, or additional representational skills are welcomed. Some research experience would be useful.

Application

Please apply by submitting a CV, portfolio, and short writing sample to snzhang@kpf.com with the subject line “Summer 2021 Internship Application.” The deadline to apply is March 30th. The position will be remote, but candidate will need to be located within the U.S. for the duration of the internship. Questions about the application should be directed to snzhang@kpf.com.

Will Autonomous Vehicles Usher in a Spotless Future?

KPF_DriverlessNY_CleanAir_LoRes.jpg

There is no shortage of speculation about what kind of impact autonomous vehicles will have on cities. One commonly touted theory is that they will significantly reduce the need for parking lotsfreeing up an enormous amount of land for redevelopment. This new land could provide a huge opportunity for cities to mitigate other pressing issues such as housing affordability, economic development, and park access. 

“If parking lots become apartments, 2.5 million housing units would be added to NYC”

For instance, if all parking lots are converted to parks, there would be 8 thousand acres of park added to NYC, or almost 10 more Central Parks. If parking lots become apartments, 2.5 million housing units would be added to NYC (at 1,000 sf per unit) , a 75% increase in the number of housing units! Or, if parking becomes office buildings, that space could house 12.42 million jobs. Understanding this immense potential should inform how we envision the future of cities with autonomous vehicles. Because of the enormous impact this could have on cities, KPF initiated a research project to both quantify the off-street parking in New York City, as well as simulate the impact of redeveloping it.  

Spotless

The degree to which existing parking will become unnecessary, if at all, is very much up for debate. Discussions about this topic explore a range of scenarios about how much parking will be reduced, and where within a city those reductions will take place. Because of this uncertainty, we approached this research project with the goal of avoiding a single deterministic outcome. Instead, we embraced uncertainty so that we, and everyone else, could explore a large range of potential futures. 

Our solution was to build an interactive web app, called Spotless, that puts the user in the driver’s seat. Recently unveiled at the Metropolis Think Tank panel Leveraging Technology for Adaptable City Planning, this app can be used to explore a large range of potential redevelopment scenarios by deciding what amount of parking lots get redeveloped, and what they get redeveloped as. Through the use of a single slider, they can determine percentage of parking lots that: 

1) stay as parking lots 

2) get converted to park 

3) get redeveloped as residential use 

4) get redeveloped as commercial/office use 


This allows them to explore extreme scenarios, such as converting every parking lot to park space. New York would become a much greener city with more immediate access to parks in many neighborhoods. Or they can explore one of a countless number of mixed scenarios. Perhaps 25% of parking lots become parks, 50% become residential, and the remaining 25% stay as parking lots.  

We categorized all of NYC’s off-street parking into 4 types.

We categorized all of NYC’s off-street parking into 4 types.

Methodology

In order to create these scenarios, we first had to find every parking lot and garage in New York City. To do this we took advantage of NYC’s open data sources including their dataset of surface parking, and the PLUTO dataset which includes information about parking garages. With these 2 datasets we were able to quantify the area of parking on every parcel in New York City, as well as the type of parking. To find the number of parking spots, we divided the area of parking by 300 sf, which is a conservative estimate of the amount of area you need per vehicle. This includes both the parking space itself, as well as the drive isles needed to access that space. We found that there are 4 main parking lot types: 1) single use surface parking covering the whole site, 2) accessory surface parking for a building, 3) standalone parking garages, and 4) parking garages built into a larger building.  


The next step was determining how large a building could be built on the site given zoning code and constraints in terms of construct-ability. Again, we used the PLUTO dataset to determine the allowable built density. The measurement of FAR (floor area ratio) specifies the total built area allowed as a ratio of the lot area. For example, a FAR of 1 would allow you to build a one-story building across the entire parcel, or a 4-story building on a quarter of the parcel.  


“We focused on putting the user in control of the potential future scenarios”

Then, we determined the percentage of the parcel that could actually be developed. This is where the parking lot types came in. For the “full lot surface parking” and “standalone parking garages”, the entire parcel can be redeveloped. For “accessory surface parking” only the parking lot can be redeveloped because there are still buildings on the other part of the site. The “parking garages built into a larger building” cannot be easily redeveloped. Many of them have low floor to ceiling heights or are in the interior of buildings and don’t have any daylight access. Therefore, we decided to omit them from the parcels that can be redeveloped. 


Once we determined how much could be built on each parcel, we assigned each parcel a total potential 1) area of park space, 2) number of housing units, and 3) number of workers. The park space was determined by the buildable area of the site, the number of housing units assumed 1000sf per unit, and the number of workers assumed 200sf per worker. For residential and office buildings we removed 20% from the total building area assuming that lobbies, hallways, elevators, and fire stairs would require floor area. With these calculations, we can understand the potential of converting each parking lot to any one of these 3 uses. 

These are just 3 scenarios that can be generated using the slider.

These are just 3 scenarios that can be generated using the slider.

Planning for a Spotless Future

When exploring the data in the web app, we focused on putting the user in control of the potential future scenarios. We did this by creating a simple slider that allocates percentages of parking lots to new uses. The slider picks parcels at random from the entire city. So, if you are making 25% of parcels commercial, the app will select a random 25% of parcels and then sum the total number of workers they could accommodate. 


What we can learn from this is that there are vastly different outcomes depending on what percentage of each use gets developed. Without any specific policy or planning, it’s likely that parking lots will get redeveloped as their new highest and best use as determined by the market. With a tool like this the city can dynamically explore different outcomes and be proactive about introducing planning and policy to achieve their desired results. In addition, this tool makes this data accessible to the public that can then engage the public sector in a more informed way. Too often, planning knowledge is communicated in lengthy reports which prevents it from being widely understood. This type of tool provides a model for how the city can inform and engage its citizens and better serve the public. Check out our other tools here.

Interactive Design with Sidewalk Labs

IMG_2567.JPG

We recently worked with Sidewalk Labs, the urban-innovation organization within Google’s parent company Alphabet, and Montreal-based experiential designers Daily tous les jours, to create an interactive prototype for community engagement: the Plan Your Neighbourhood exhibit launched as part of 307, the experimental workspace at Sidewalk Toronto.

For the prototype, we generated thousands of urban design scenarios using our Smart(er) City methodology: testing combinations of design inputs like type of street grid, population, building heights, the amount of green space and how it is distributed, and finally, what shape the buildings take. These scenarios were then evaluated according to various performance criteria such as outdoor comfort, energy efficiency, views, daylight, and pedestrian enjoyment.

Design Visualization

Design Visualization

Analysis Visualization

Analysis Visualization

Visitors explored these combinations by toggling wooden knobs to change design inputs. This allows users to create the type of neighborhood they want, and to then understand how those design decisions impact the functioning of a complex system like a city.

The goal of community engagement platforms like Design Your Neighbourhood is to encourage design and introspection in equal measure. Our favorite example from the opening weekend was the participant who started with the lowest population and the most green space (she wanted a backyard of her own), but quickly realized that this led to low scores for outdoor comfort and energy efficiency (two things she valued). By making a few quick adjustments she found an option that performed well for those two priorities; the kind of compromise solution that would greatly improve the performance of North American suburbs.

IMG_2569.JPG
Feedback.jpg

People have opinions about the places they live and work, but there is rarely a common language for describing a neighborhood’s essential qualities and its performance for the people who live there. An engaged process allows us – the designers, developers and planners – to balance various stakeholders of the urban environment and to proactively and responsibly accommodate growth. 

The Plan Your Neighbourhood prototype, and our KPF Scout and CityBot, can be used by city agencies and developers alike to engage with the public in the very early stages of the planning process. Their application is easily applied to specific projects around the world for the public to explore trade-offs between various options and also to understand the general process more fully.

Tools like these create a shared understanding that facilitates effective communication, and allow the next generation of smart cities to live up to their potential as places for people.  

Street Experience

Icon.jpg


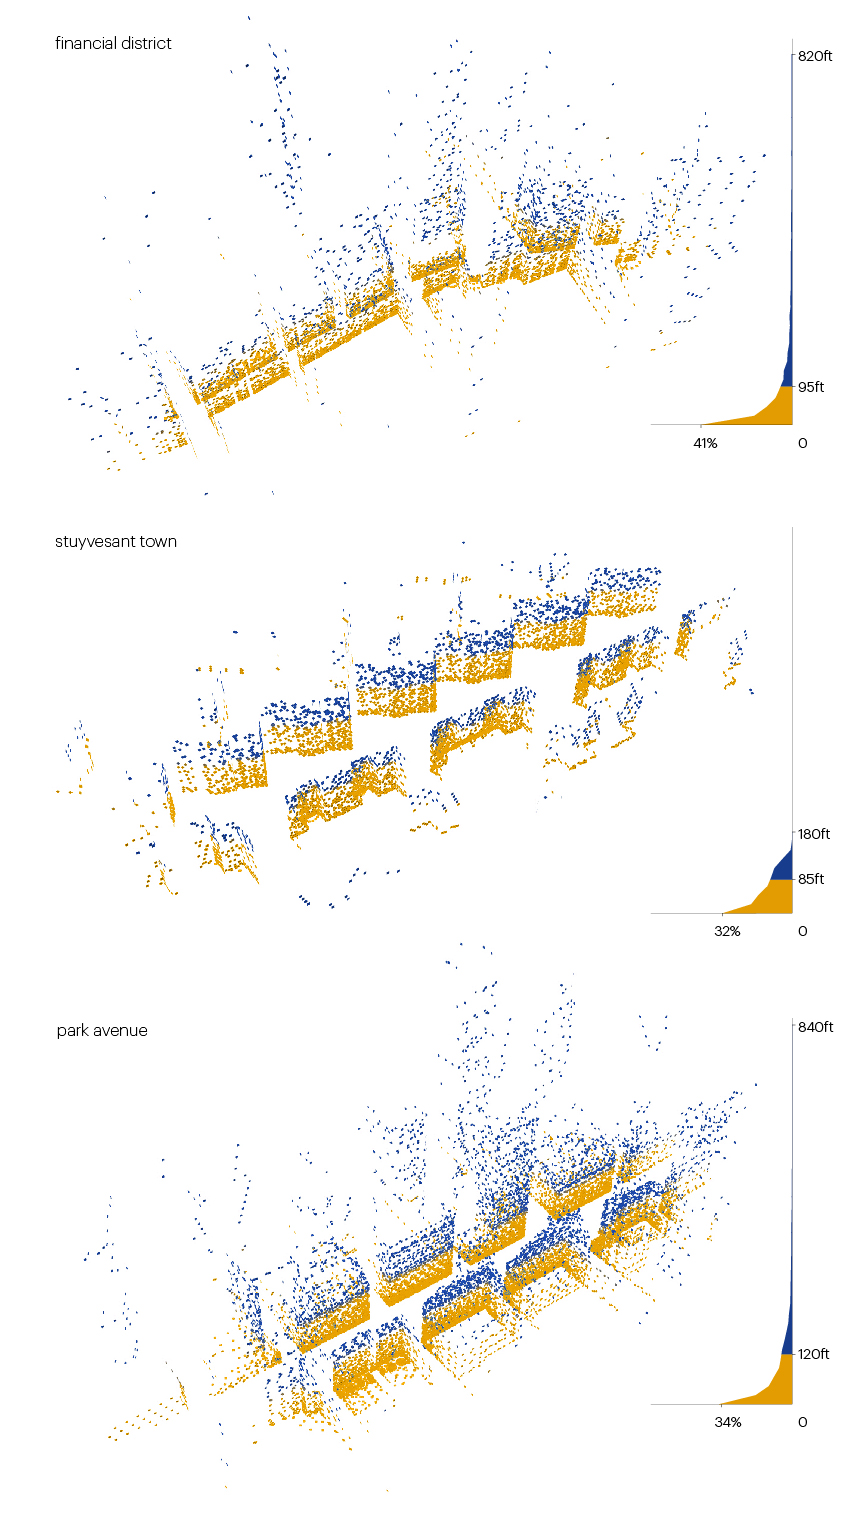
The aim of this study is to understand how building height and street width impact street-level experience. Our research indicates that buildings (or the portion thereof) that reach up to 120ft. are what define the pedestrian's visual experience-- any area above that height has very little visual impact at the ground.


Analysis Methodology

Fig 1 - Typical Analysis

Fig 1 - Typical Analysis

The street plane is divided into a regular grid and vectors are projected in all directions from each point. Next vectors are tested for intersection with the built context. Collectively, the intersection points visually recreate the image of the city as experienced from the ground level.

Legend.jpg

The points are colored based on their 'Height Value', depicted in the legend above, and the Y axis in the following graphs represents height. The X axis shows our set of points binned into representing segments of 20ft height intervals. To get a sense of where majority of the points lie, a color switch happens after encountering 80% of the points, and the color break height varies by study area.


New York City Study

Fig 2 -  Lower Manhattan and Midtown, New York City

Fig 2 -  Lower Manhattan and Midtown, New York City

For the purpose of the study, 3 neighborhoods are selected in each of New York and London. The neighborhoods are carefully chosen to represent a variety of combinations of street widths and building heights:

  • Park Avenue - High Rise, Wide Street
  • Financial District - High Rise, Narrow Street
  • Stuyvesant Town - Mid Rise, Wide Street
Fig 3 - New York City streets analysis

Fig 3 - New York City streets analysis

London City Study

Fig 4 - Locations in London City identified for analysis.

Fig 4 - Locations in London City identified for analysis.

  • Leadenhall Street - Mid Rise, Narrow Street
  • Westminster - Low Rise, Wide Street
  • Covent Garden - Low Rise, Narrow Street
Fig 5 - London streets analysis

Fig 5 - London streets analysis

Fig 6 - When applied to enough neighborhoods, the tool begins to create an experiential image of the city

Fig 6 - When applied to enough neighborhoods, the tool begins to create an experiential image of the city

Conclusions

Fig 7 - Analysis Graphs

Fig 7 - Analysis Graphs

In overlapping our six neighborhood graphs, a pattern begins to emerge: in high rise neighborhoods, 80% of the street experience is defined within 10-15% of the maximum height from the ground. On Narrow or Wide streets, Short or Tall towers, structures above 120ft have a minimal effect on the street experience, as they generally aren’t visible to passersby.

Fig 8 - Road Width Correlation

Fig 8 - Road Width Correlation

A close read of the graphs reveals that:

  • for narrow streets - buildings closest to the ground have the maximum visual impact and that impact drops sharply with height;
  • for wider streets - the lowest buildings contribute relatively less to the experience;
  • for wider streets - higher buildings contribute relatively more to the experience.

This analysis suggests that street width has a direct correlation with the experience of surrounding building heights. Visibility on narrower streets is limited to buildings close to the ground. As the road width increases, more street experience is governed by taller towers. One possible takeaway is that perhaps signature elements of the building design should be concentrated at ground level, or whether design features should aim to draw the eye upward. 

Measuring the City that Never Sleeps

The most desirable neighborhoods to live and work are those that radiate a sense of activity during the day and throughout the night. Active streets and public spaces feel vibrant, support diversity of both people and activities, and increase safety. Urbanists celebrate the dynamic nature of experience by striving for the ideal, “24-hour neighborhood” in the planning and design of new and existing urban neighborhoods.


Reacting against the zoning policies that created office-centric districts, which quickly became vacant after 5pm, urban planners began adopting new city typologies to activate these empty districts. Adding opportunities for residential and promoting a mix of uses will enliven a neighborhood at all hours, even on weekends. Retail, restaurants, entertainment, and night life promote activity and establish a sense of community.

Places_neighborhoods.png

What We're Doing 

The implications mixed-use, 24-hour neighborhoods have on the urban experience are complex, especially considering their qualitative nature. KPFui explores tools and methodologies to gain some insight into the urban condition and formulate more concrete definitions of the “ideal neighborhood.”


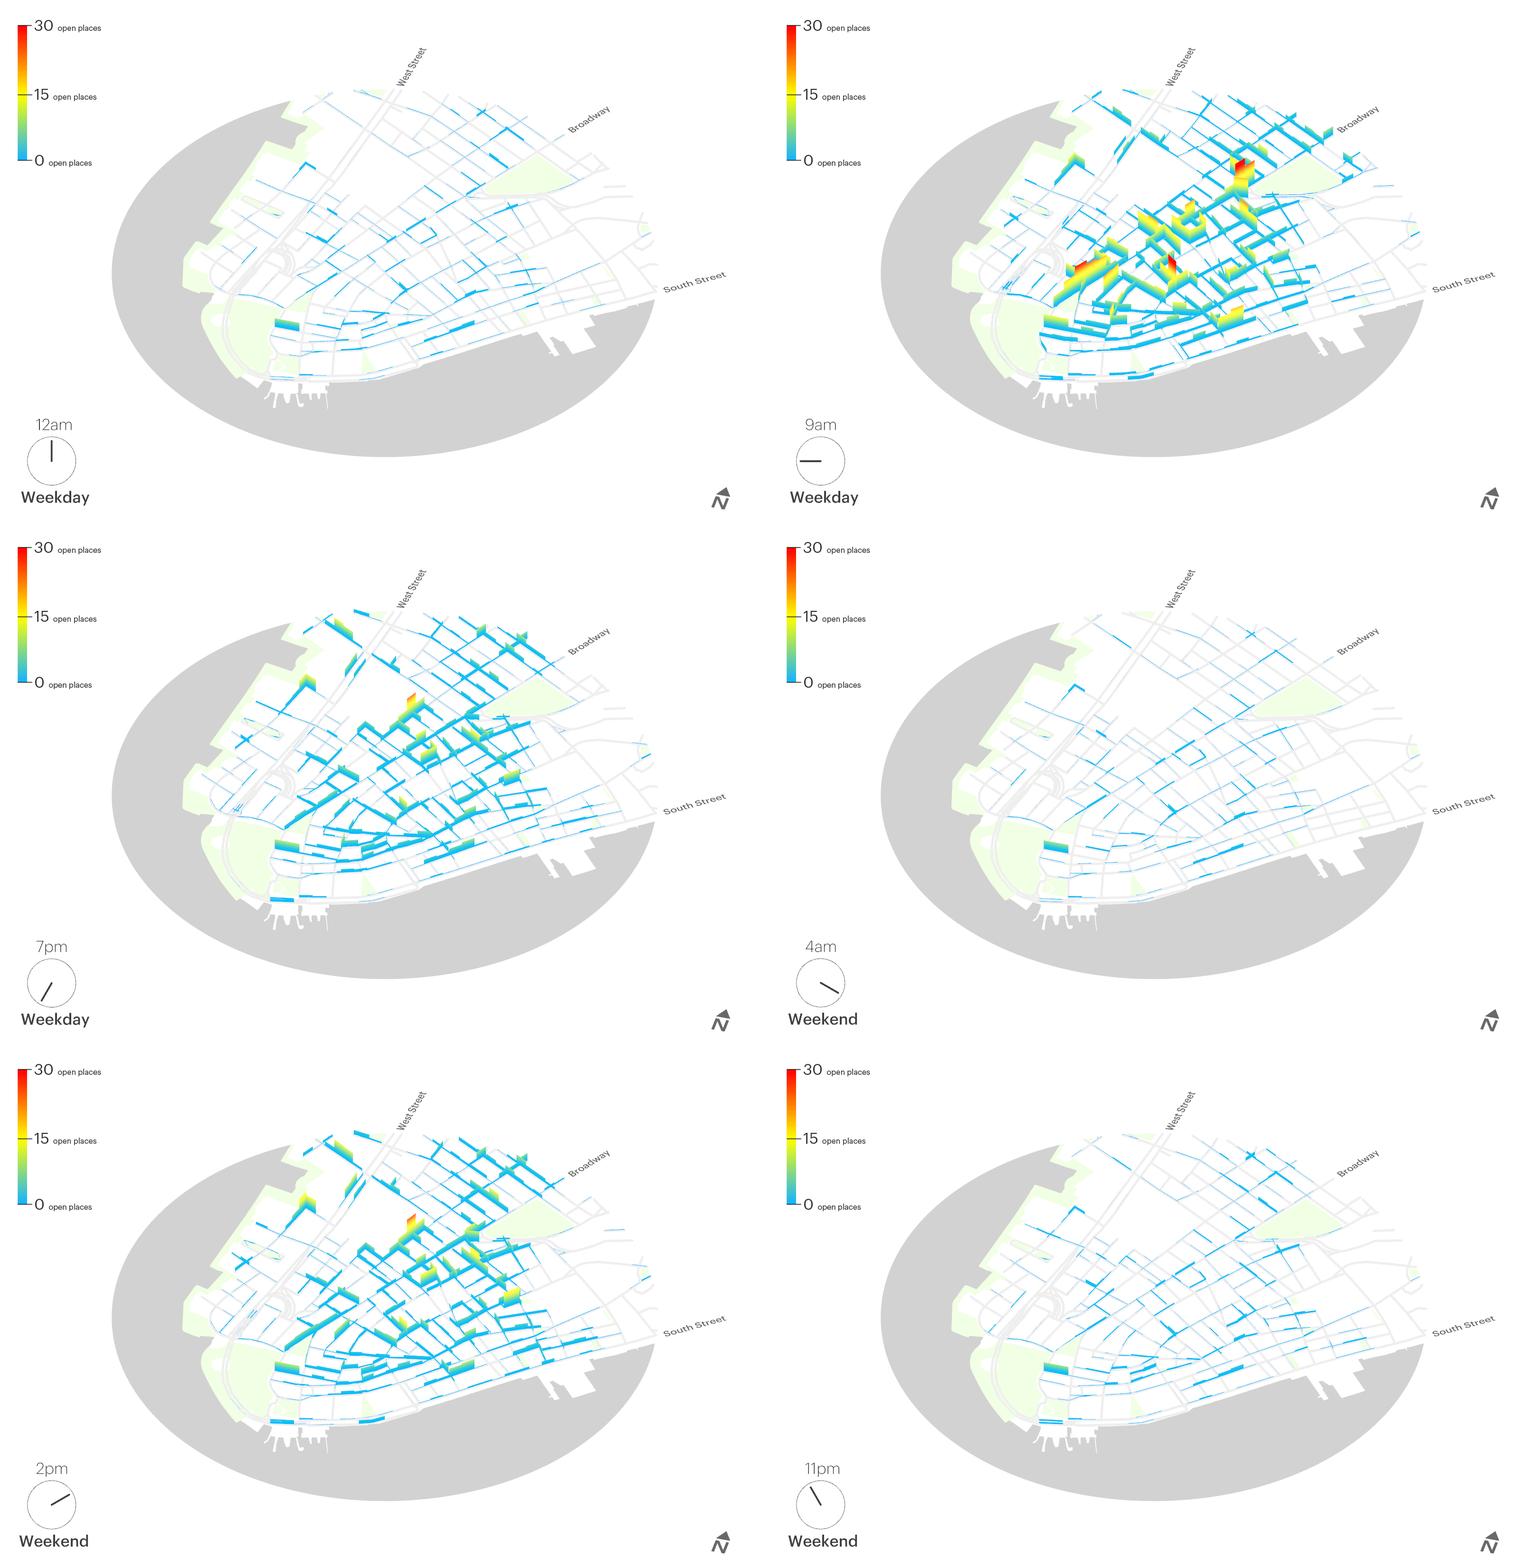
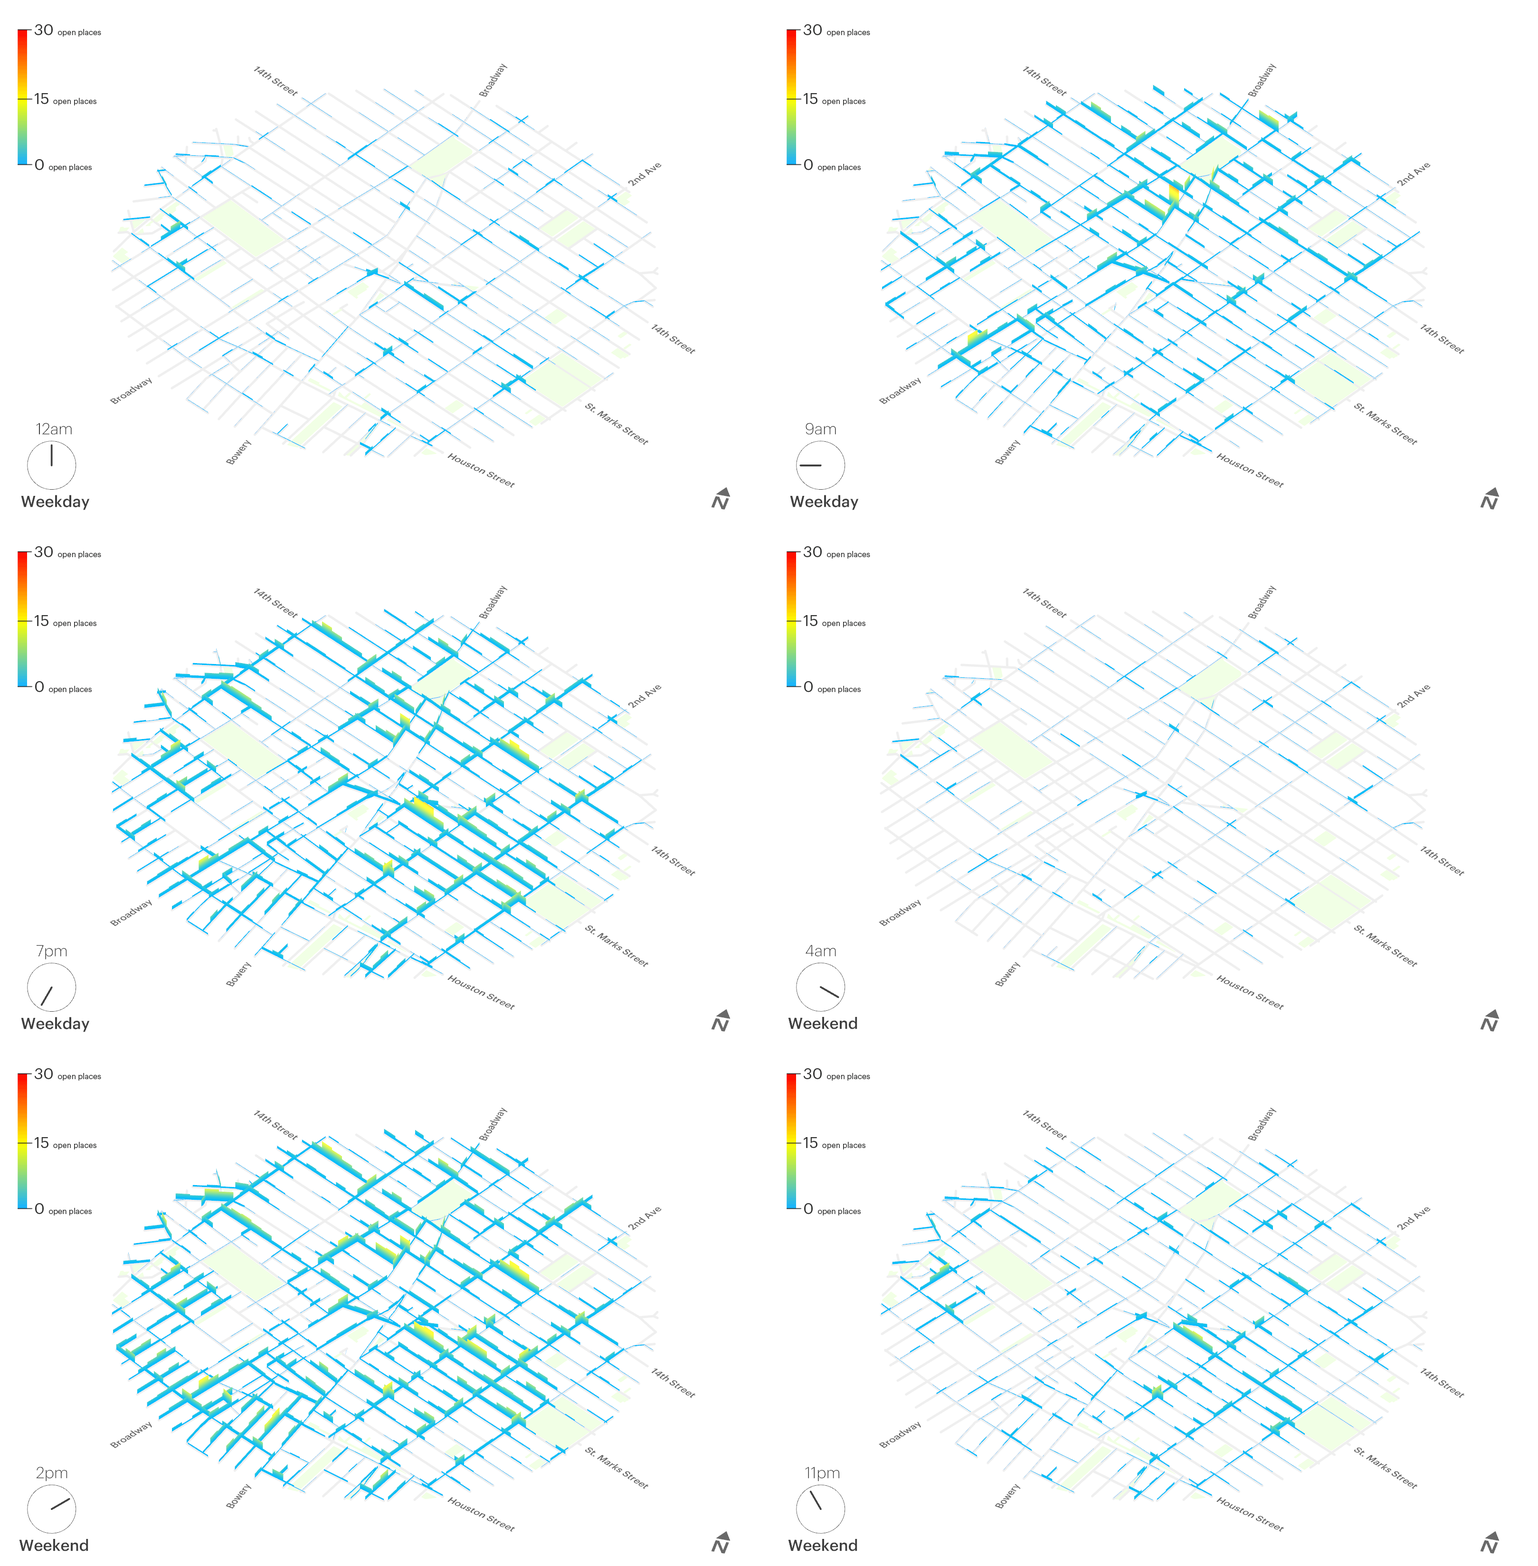
Google Places, the dataset that informs the search function of Google Maps, provides a wealth of information pertaining to businesses around the world, including name, location, web address, ratings and reviews, price range, and hours of operation. With endless possibilities for evaluating such an all-encompassing dataset, this quick study visualizes hours of operation of businesses across three areas of New York City: the Financial District, East and Greenwich Villages, and Midtown. Open businesses are visualized over 24-hour increments on Wednesday and Saturday, selected to represent weekday versus weekend activity.


Analysis and comparison of the resulting animations give some clues as to how the density, diversity and accessibility of various business types impact the experience of the street.


Financial District, Manhattan

WallStreet_time_2.gif

In the Financial District, there are more open businesses on Wednesday than Saturday, a dramatic difference that presumes that this area of Manhattan is largely made up of offices.

East Village and Greenwich Village, Manhattan

AstorPlace_time_2.gif

The level of activity on Wednesday and Saturday is more uniform than in the Financial District, implying that the neighborhoods are predominantly residential and retail focused. Broadway, known for its retail, attracts traffic on both days fairly consistently. The rich night life that the East Village is known for is also apparent per the density of businesses open late into the night.  


Midtown, Manhattan

TimesSquare_time_2.gif

Midtown shows similarities to the Financial District in lower Manhattan with much less activity on Saturday than during the week. However, because of its close proximity to Times Square, a  major tourist destination, the area sees more consistent activity during the day time on weekends than the Financial District.  

Getting "There" - A 10 Minute Trip

KPFui’s introduction to place-based analytics continues with an exploration of the “there” of urban experience. As previously discussed, there relates to a city’s interconnectedness. Livelihood, at both individual and city scales, is dependent on the ability to move from place to place with relative ease and sufficient speed. Movement from here to there is a requisite for urban prosperity and allows people and places to thrive in harmony. Read the first part of the series here.

New Yorkers most commonly travel by a combination of walking and subway rides. KPFui’s “10 Minute Trip” tool creates a comprehensive visualization of everyday movement in New York. By addressing the fundamental differences in pedestrian and subway transit, an insight is offered into the relationship between distance and time.

Fig 1 - A comparison between Grand Central and Queensboro Plaza in Queens shows how transit can almost collapse and expand space.

The Tool Explained

Beginning with a defined starting point, the 10 Minute Trip tool shows every building that is accessible within a 10 minute radius. Color-shading depicts the time required to reach each building, marked in one minute increments. The key differentiator between this and more commonly used walking time analysis tools is that KPFui’s tool integrates walking times with the time required for subway travel. Subway stations in proximity, various train lines, average wait times, and additional stops are all considered. For example, walking to a station, waiting for the train, making a transfer, and walking to a final destination may all occur within a 10 minute timeframe and is imagined with the tool.


Fig 2 - Explanatory Diagram

KPFui’s analysis yields a nuanced view of the there of any given place. The images depict potential travel distances, the quantity of sites within reach of a given point, and give broad insight into the experiential qualities of travel, which can be seen in changes in density. Bustling hubs of activity contrast with less connected neighborhoods and perpetuate a perception of isolation. The visualizations also show that time and distance are fluid. Destinations farther from the starting point may be reachable within 10 minutes of travel, while closer points are not.

The inner workings of New York and its citizens are highlighted with snapshot comparisons of transit centers throughout the city. The intensity of Grand Central’s statistics and visible density clearly position the terminal as one of the city’s prominent hubs. Considering Atlantic Avenue and Queensboro Plaza side by side, differences exist mostly in daily ridership, suggesting that the Queens station functions mostly as a gateway. Passengers are very likely passing through without disembarking or engaging with the immediate neighborhood.

Fig 3 - Grand Central, Manhattan:

Maximum travel distance: 9,171 feet

Buildings accessible: 4,157

Accessible GFA: 319,232,465 SF

Daily ridership: 158,580

Fig 4 - Queensboro Plaza, Queens:

Maximum travel distance: 9,318 feet

Buildings accessible: 5,024

Accessible GFA: 68, 019,605 SF

Daily ridership: 23,588

Fig 5 - Atlantic Avenue/Barclays Center, Brooklyn:

Maximum travel distance: 9,309 feet

Buildings accessible: 7,660

Accessible GFA: 90,571,831 SF

Daily ridership: 42,711

Fig 6 - Queensboro Plaza in Detail. Accessible places within 10 minutes decrease dramatically the farther away a passenger moves from Manhattan.

The 10 Minute Trip tool can also highlight disparities between less connected areas of the city. The Red Hook neighborhood along the Brooklyn waterfront shows isolation and a lack of interconnectedness to the rest of the city with no immediate subway access, while Sunnyside, Queens shows similar isolation with only a single subway line.

Fig 7 - 46th Street, Sunnyside, Queens: Max Distance 8,810', Buildings Accessible 4,796, GFA Accessible 39,213,553, Daily Ridership 14,335

Fig 8 - Redhook, Brooklyn. Max Distance 2,640', Buildings Accessible 1,105, GFA Accessible 11,667,922, Daily Ridership NA

The 10 Minute Trip tool can be applied across scales, providing a comprehensive view of the varying conditions of connectivity that exist within a single city. Below, the tool is applied to the entire length of Broadway, one of New York's most iconic streets. Running from the northern tip of Manhattan at 220th Street all the way south to Battery Park, the visualization demonstrates both the remarkable intertwining and uneven distribution of the New York City subway system. 

Fig 9 - 10 Minute Trip analysis along Broadway, Manhattan

Any sufficiently robust analysis system carries the potential to become a design tool. Taken together, City Mile and the 10 Minute Trip tools provide new platforms for planners, designers, urbanists, and architects to engage with the many conditions that define the world’s metropolitan places. Compelling visualizations will attract both the committed stakeholder and the casual participant, improving the dialogue that surrounds urbanism, architecture and data.

Understanding "Here" with City Mile

Architects and urbanists regularly perform data analysis to quantify space. Environmental factors, such as solar radiation and shadow casting, the tectonics of massing, and floor area optimization are just a few examples of the ways that computation informs the design of buildings and cities.

KPFui’s place-based analytics extend data’s traditional role in design, illuminating the more complex, qualitative aspects of place.

The urban experience, especially in a metropolis the size and density of New York City, may be simplified into two types of perspective: “here” and “there.” Here may be considered the relatively stationary aspects of a place, what is visible and felt, the activities partaken in the immediate moment. It consists of a place’s physical characteristics, program, density and aesthetics. There acknowledges that connectivity is the mainstay of any city: movement between places is not only inevitable, but constant and integral to the lives of the urban population. To be effective, place-based analytics must consider the here and there concept both individually and as a binary construct.

Place-based Analytics: Brooklyn Heights, New York City

City Mile

KPFui is developing the “City Mile” tool to gain insight into the conditions and character of the urban here. In the context of a one-mile diameter swath of territory, the built environment is organized into concentric rings. Each ring represents the formation of individual buildings that can be experienced as a person moves away from the center point in one minute increments. Program is illustrated by color coding and the thickness of the ring depicts built density, swelling or thinning as the amount of constructed area fluctuates. A neighborhood’s architectural tapestry, including sizes and proliferation of structures, use, and density, is brought together in an effort to effectively visualize the experience of place.

City Mile Visualization Explained

City Mile Across the Five Boroughs

Comparing City Mile visualizations from each of the city’s boroughs highlights the incredible range of built density in New York. Midtown’s overall built form lies in sharp contrast to the largely residential and mostly suburban quality of Todt Hill on Staten Island. Downtown Brooklyn’s diverse programming is fairly evenly distributed, reflecting the thriving and lively atmosphere the neighborhood is known for.

Downtown Brooklyn in Detail 

A closer look provides more detail, revealing the complexity of Downtown Brooklyn’s built environment. Rings closest to the center display large scale developments, including commercial, retail and residential programs, while outer rings show the mixed-use, smaller scale periphery that is typically associated with the neighborhood.  

Low Rise

Through analysis and visualization, KPFui is challenging common assumptions regarding neighborhood character and augmenting the design process by introducing layers of information and a deeper understanding of site. A side by side comparison of two vibrant, mixed-use neighborhoods – Greenwich Village in Manhattan, and St. George on Staten Island – quickly illustrates their similarities and differences. Both considered lower density, the ambiguous definition of "low rise" quickly becomes apparent.

Animating the Streets 

Larger conditions can be composited with City Mile, providing insight into the characteristics of thoroughfares, entire city squares, and even neighborhood adaptations over time.

The center point of this City Mile animation moves along 42nd Street in Midtown from the Hudson River to the East. While the increasing density and prevalence of office programming is to be expected, the relaxation seen at the edges showcases the kinds of development opportunities that underlie projects like Hudson Yards and Waterline Square.

Along 125th Street in Harlem, the overall density remains relatively consistent, especially in comparison to the monumental shifts in Midtown. In Harlem, however, the trend in building size is reversed, revealing a remarkably tight clustering of smaller structures toward the center of Manhattan with larger, and mostly residential, buildings further east.

Detailed images from our borough-by-borough analysis can be seen below. 

Grand Central Terminal Pedestrian Studies

East Side Access Raises Pedestrian Footfall

East Side Access will bring eight new Long Island Rail Road trains tracks to Grand Central Terminal by December 2022, raising the number of passenger trips per day to 162,000. Currently, Metro-North Trains deliver 69,700 passengers to Grand Central per hour during peak hours (Fig. 1). East Side Access is being constructed directly below Grand Central as an extension of the terminal. In the diagram, the darker the shade of blue, the deeper underground those passageways are. The following analysis visualizes the jump in pedestrian traffic from the construction of new entries and passageways planned for East Side Access.

Fig. 1

Fig. 1

Upon completion, daily commutes to Grand Central will be cut short by 30 to 40 minutes, according to MTA, but the new rails will also raise pedestrian traffic by 193%, bringing in an additional 65,000 passengers and raising the average number of pedestrians in the station to 134,700 per hour during peak hours and 7,600 per hour on average (Fig. 2).

Fig. 2

Fig. 2

Multi-level Connection Disperses Pedestrian Traffic

To integrate the total underground network of two upper platforms (Grand Central as it is), two lower platforms (East Side Access), and a mezzanine, platforms will be interconnected by four 180-feet escalators (akin to those at the new Hudson Yards station linked to the 7 train): three will be operational, the fourth a backup. Additionally, four staircase entrances linking the mezzanine to the platforms will be installed. These multi-level connections would diffuse traffic density and improve circulation (Fig. 3).

Fig. 3

Fig. 3


One Vanderbilt Upzoning Improves Net Circulation for City

Fig. 4 The extension of Vanderbilt Avenue from 43st to 42st will also absorb pedestrian footfall

Fig. 4 The extension of Vanderbilt Avenue from 43st to 42st will also absorb pedestrian footfall

Upzoning Vanderbilt Corridor (Fig. 4) made possible the development of One Vanderbilt, which will further disperse traffic density (Fig. 5). The new skyscraper will include a multi-level, hybrid space linking the labyrinthine below grade to the street level.

Fig. 5

Fig. 5

Under current conditions, additional passengers from East Side Access would worsen street level traffic around One Vanderbilt by 3.6%. With One Vanderbilt and the Vanderbilt Avenue extension, increased traffic from East Side Access will be absorbed by those new developments, which will, in fact, improve pedestrian walkability by a net 2.9% (Fig. 6).

Fig. 6

Fig. 6

The development of One Vanderbilt and the extension of Vanderbilt Avenue alone would improve nearby pedestrian levels by 22.5%. If East Side Access is introduced without allowing for the Vanderbilt Avenue extension, the new train routes will diminish pedestrian walkability by 0.7%.

The development of One Vanderbilt will nearly even out increased traffic from East Side Access and benefit the neighborhood, testaments to rezoning in favor of more developments.